BLUEPOST
Brand Identity
BLUEPOST, a digital communication and intelligence platform based in the Dominican Republic, is dedicated to simplifying complex information in the fields of economics, politics, and social affairs. The platform's mission is to distill data into easily digestible content, serving decision-makers and active professionals alike.
This brand identity design reflects Blue Post's dedication to integrity, trust, in-depth information, and impartiality. It provides a visual representation of the platform's commitment to simplifying complex data for its users.
This brand identity design reflects Blue Post's dedication to integrity, trust, in-depth information, and impartiality. It provides a visual representation of the platform's commitment to simplifying complex data for its users.
Creative Strategy
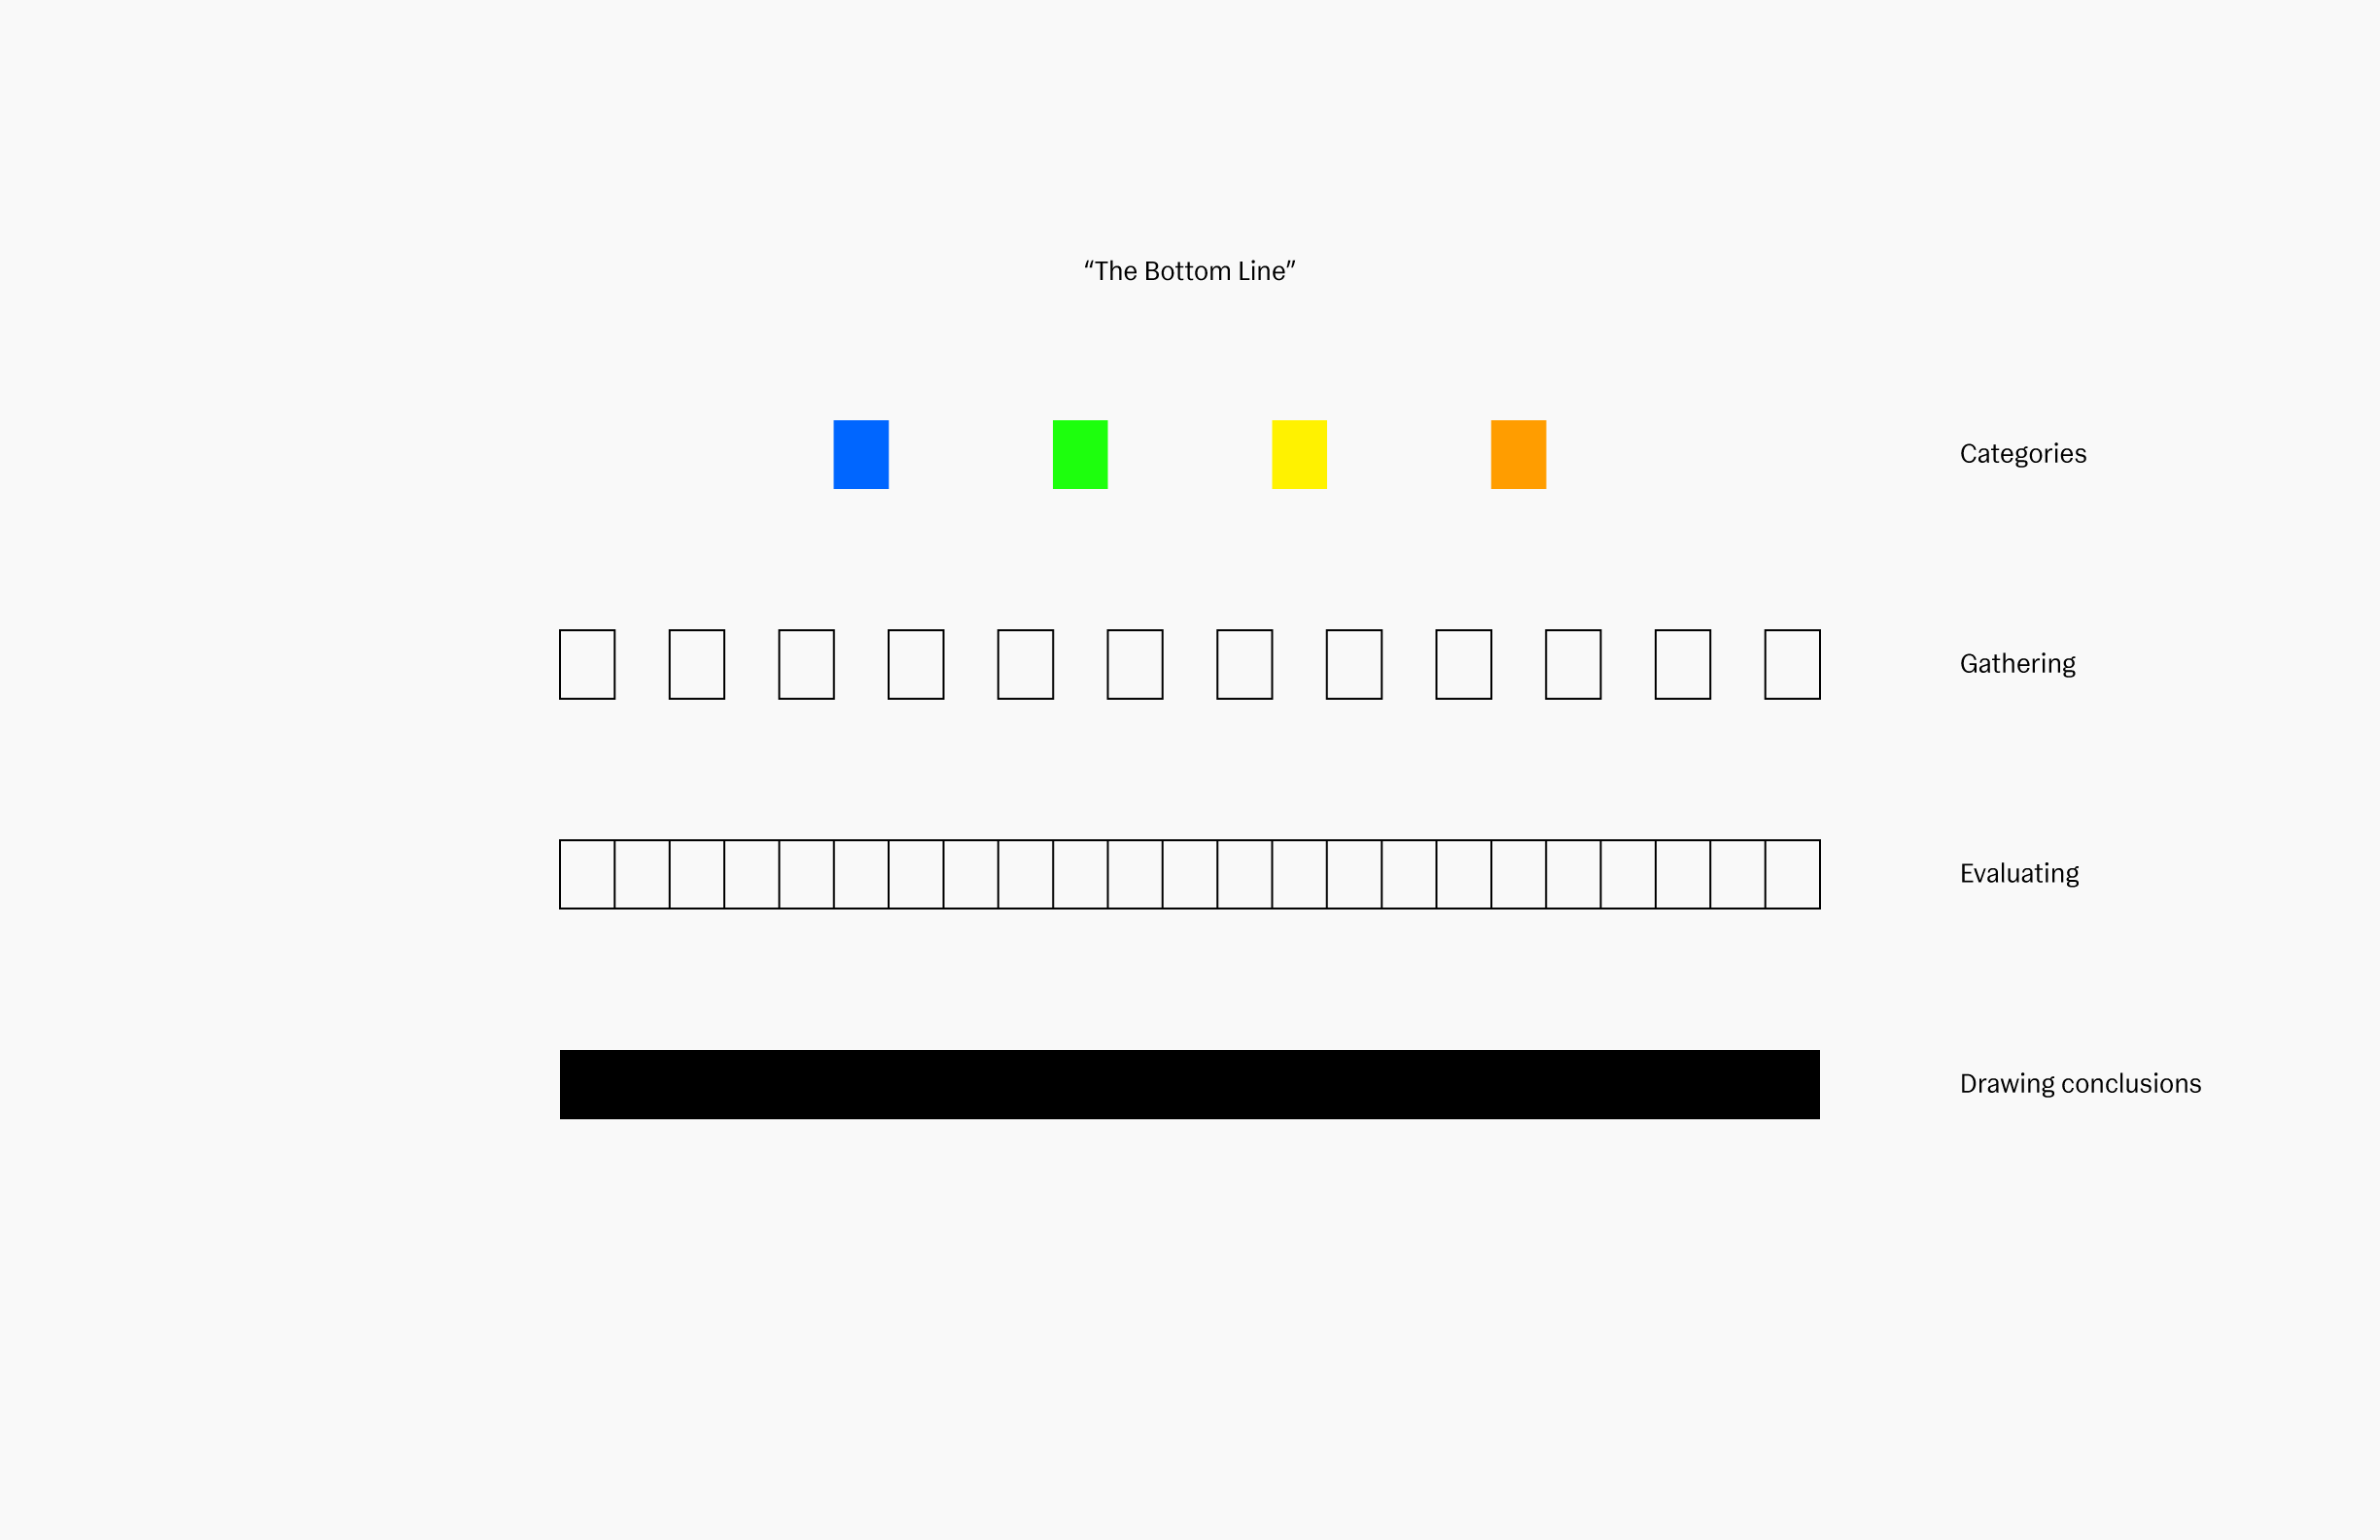
‘The Bottom Line’ is a central element in Blue Post’s creative strategy. Positioned beneath the typographic logo, this graphic component plays a crucial role within the brand identity system. It symbolizes core values like fairness and stability while visually representing the intelligence analysis process: gathering, evaluating, and drawing conclusions from information.
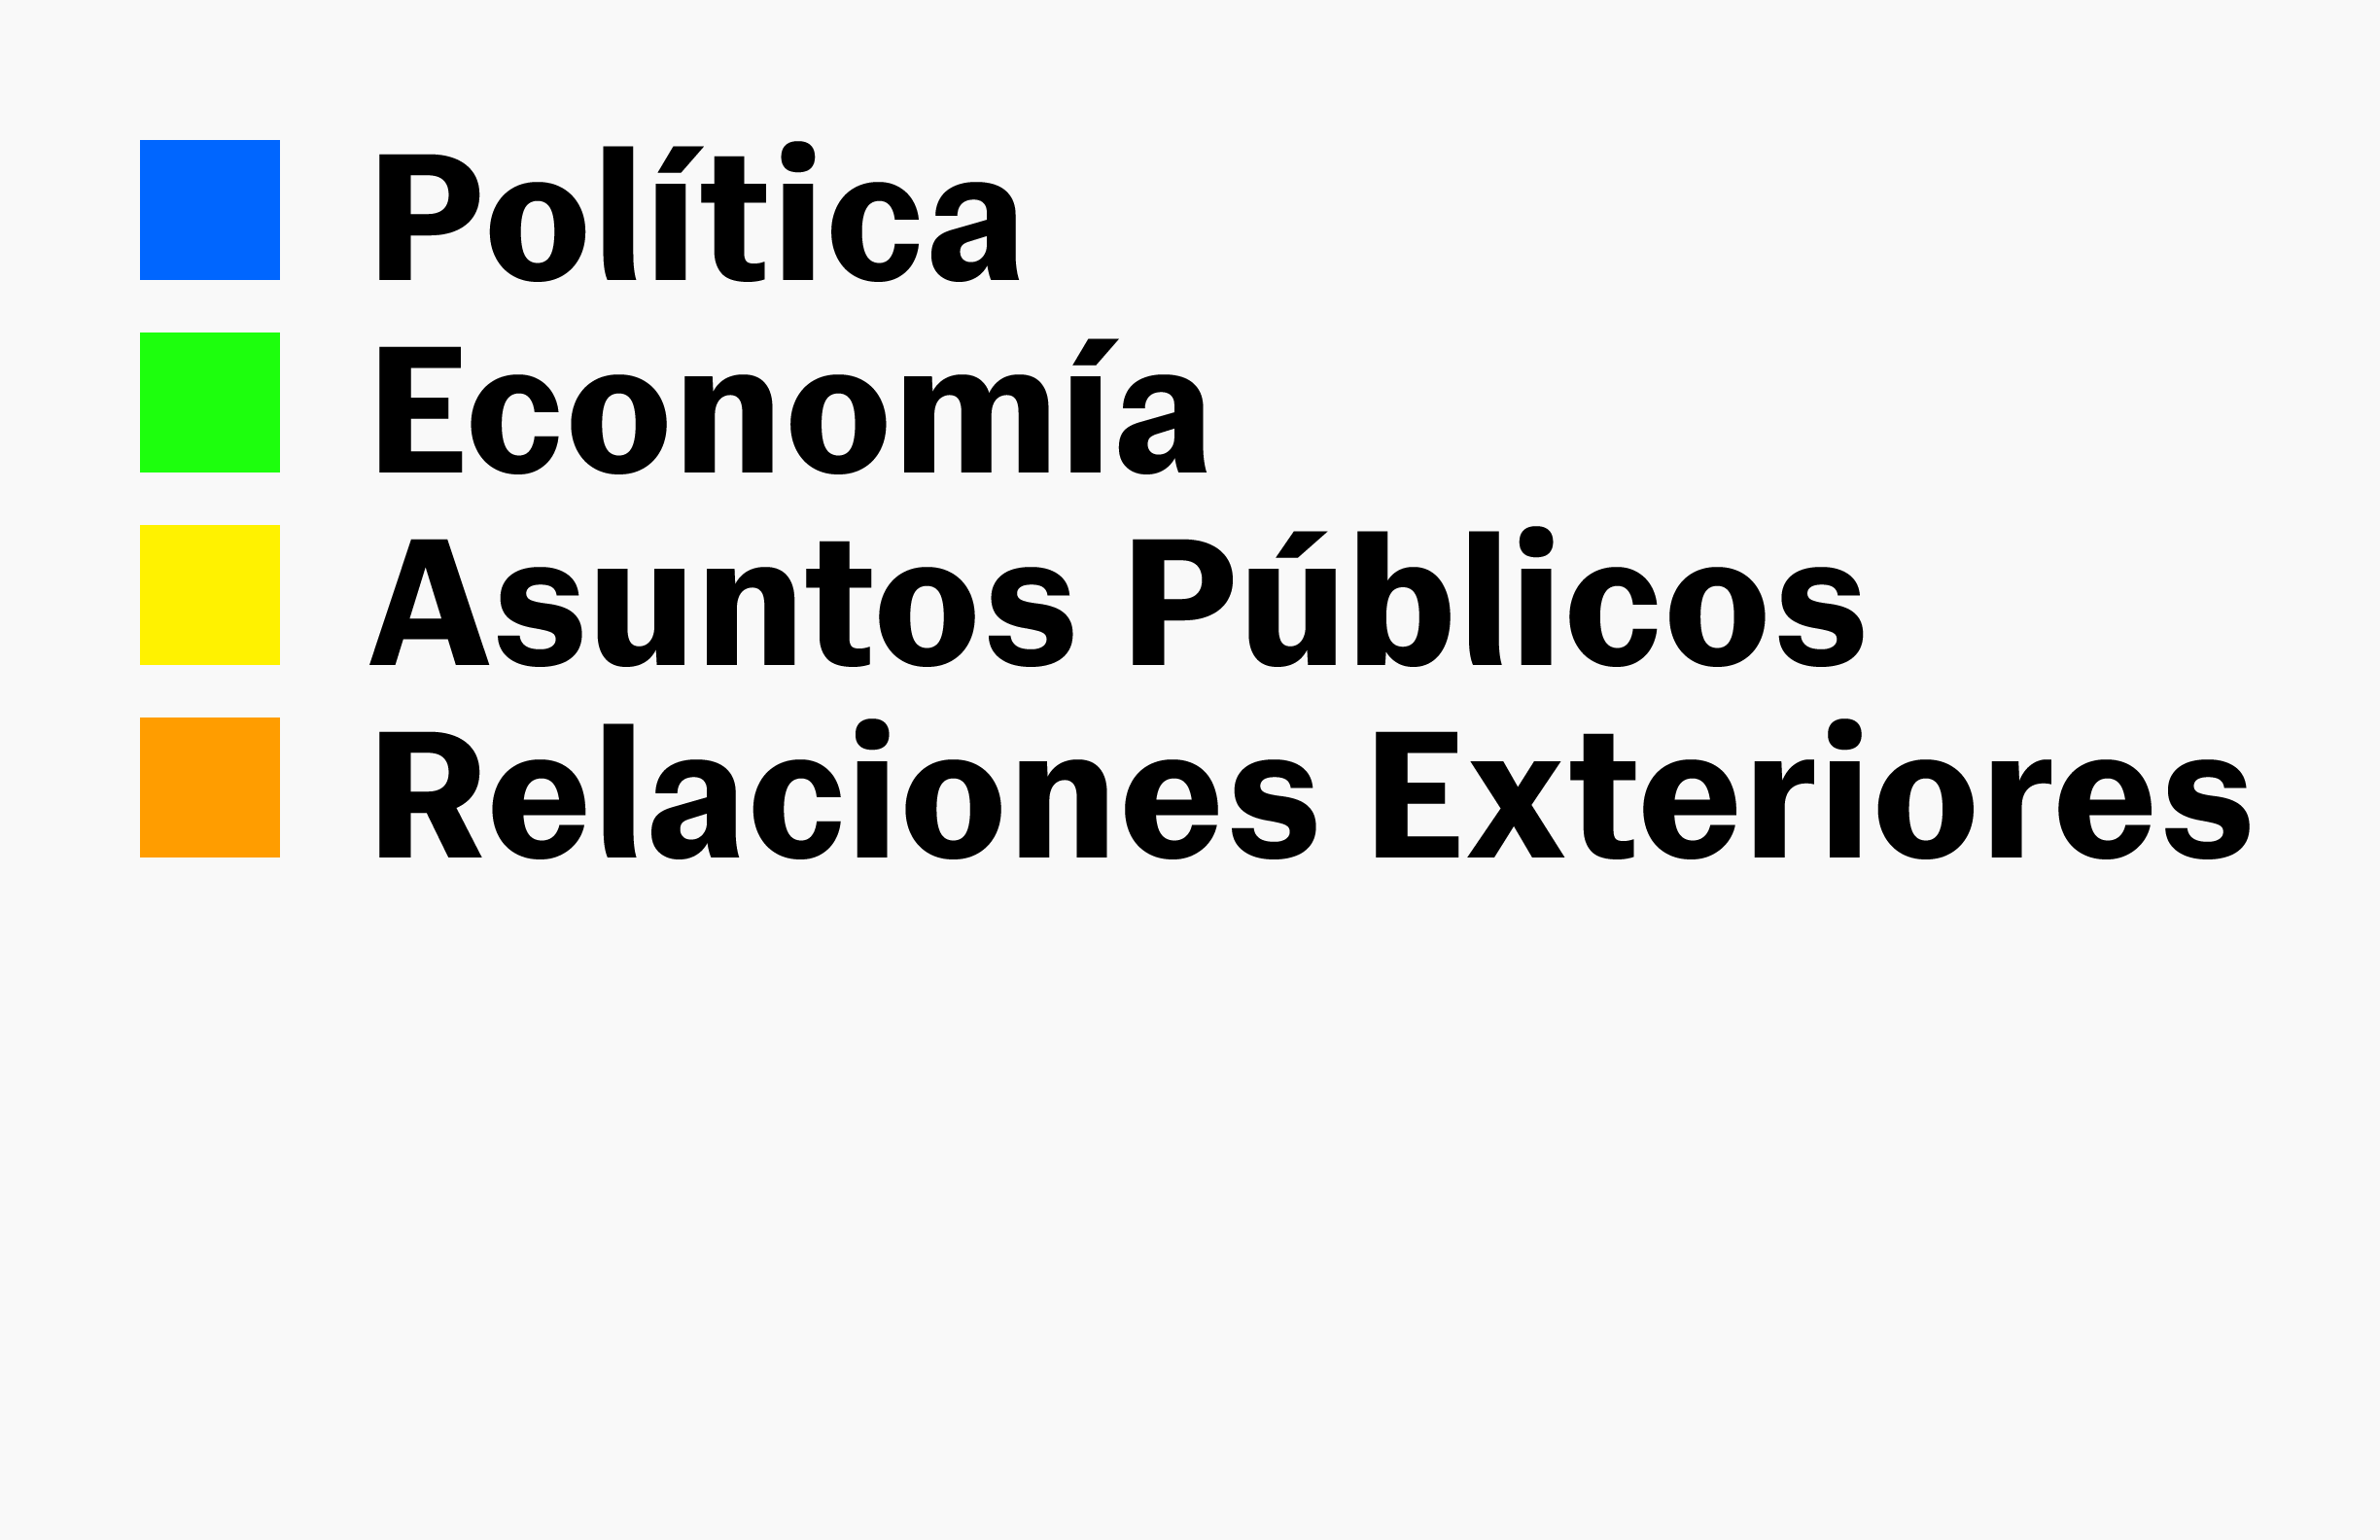
Color System
To enhance the digital experience and create a seamless, organized interface, we developed a color-coded system for Blue Post. Each main topic category is assigned a unique color scheme, simplifying navigation and improving user engagement.
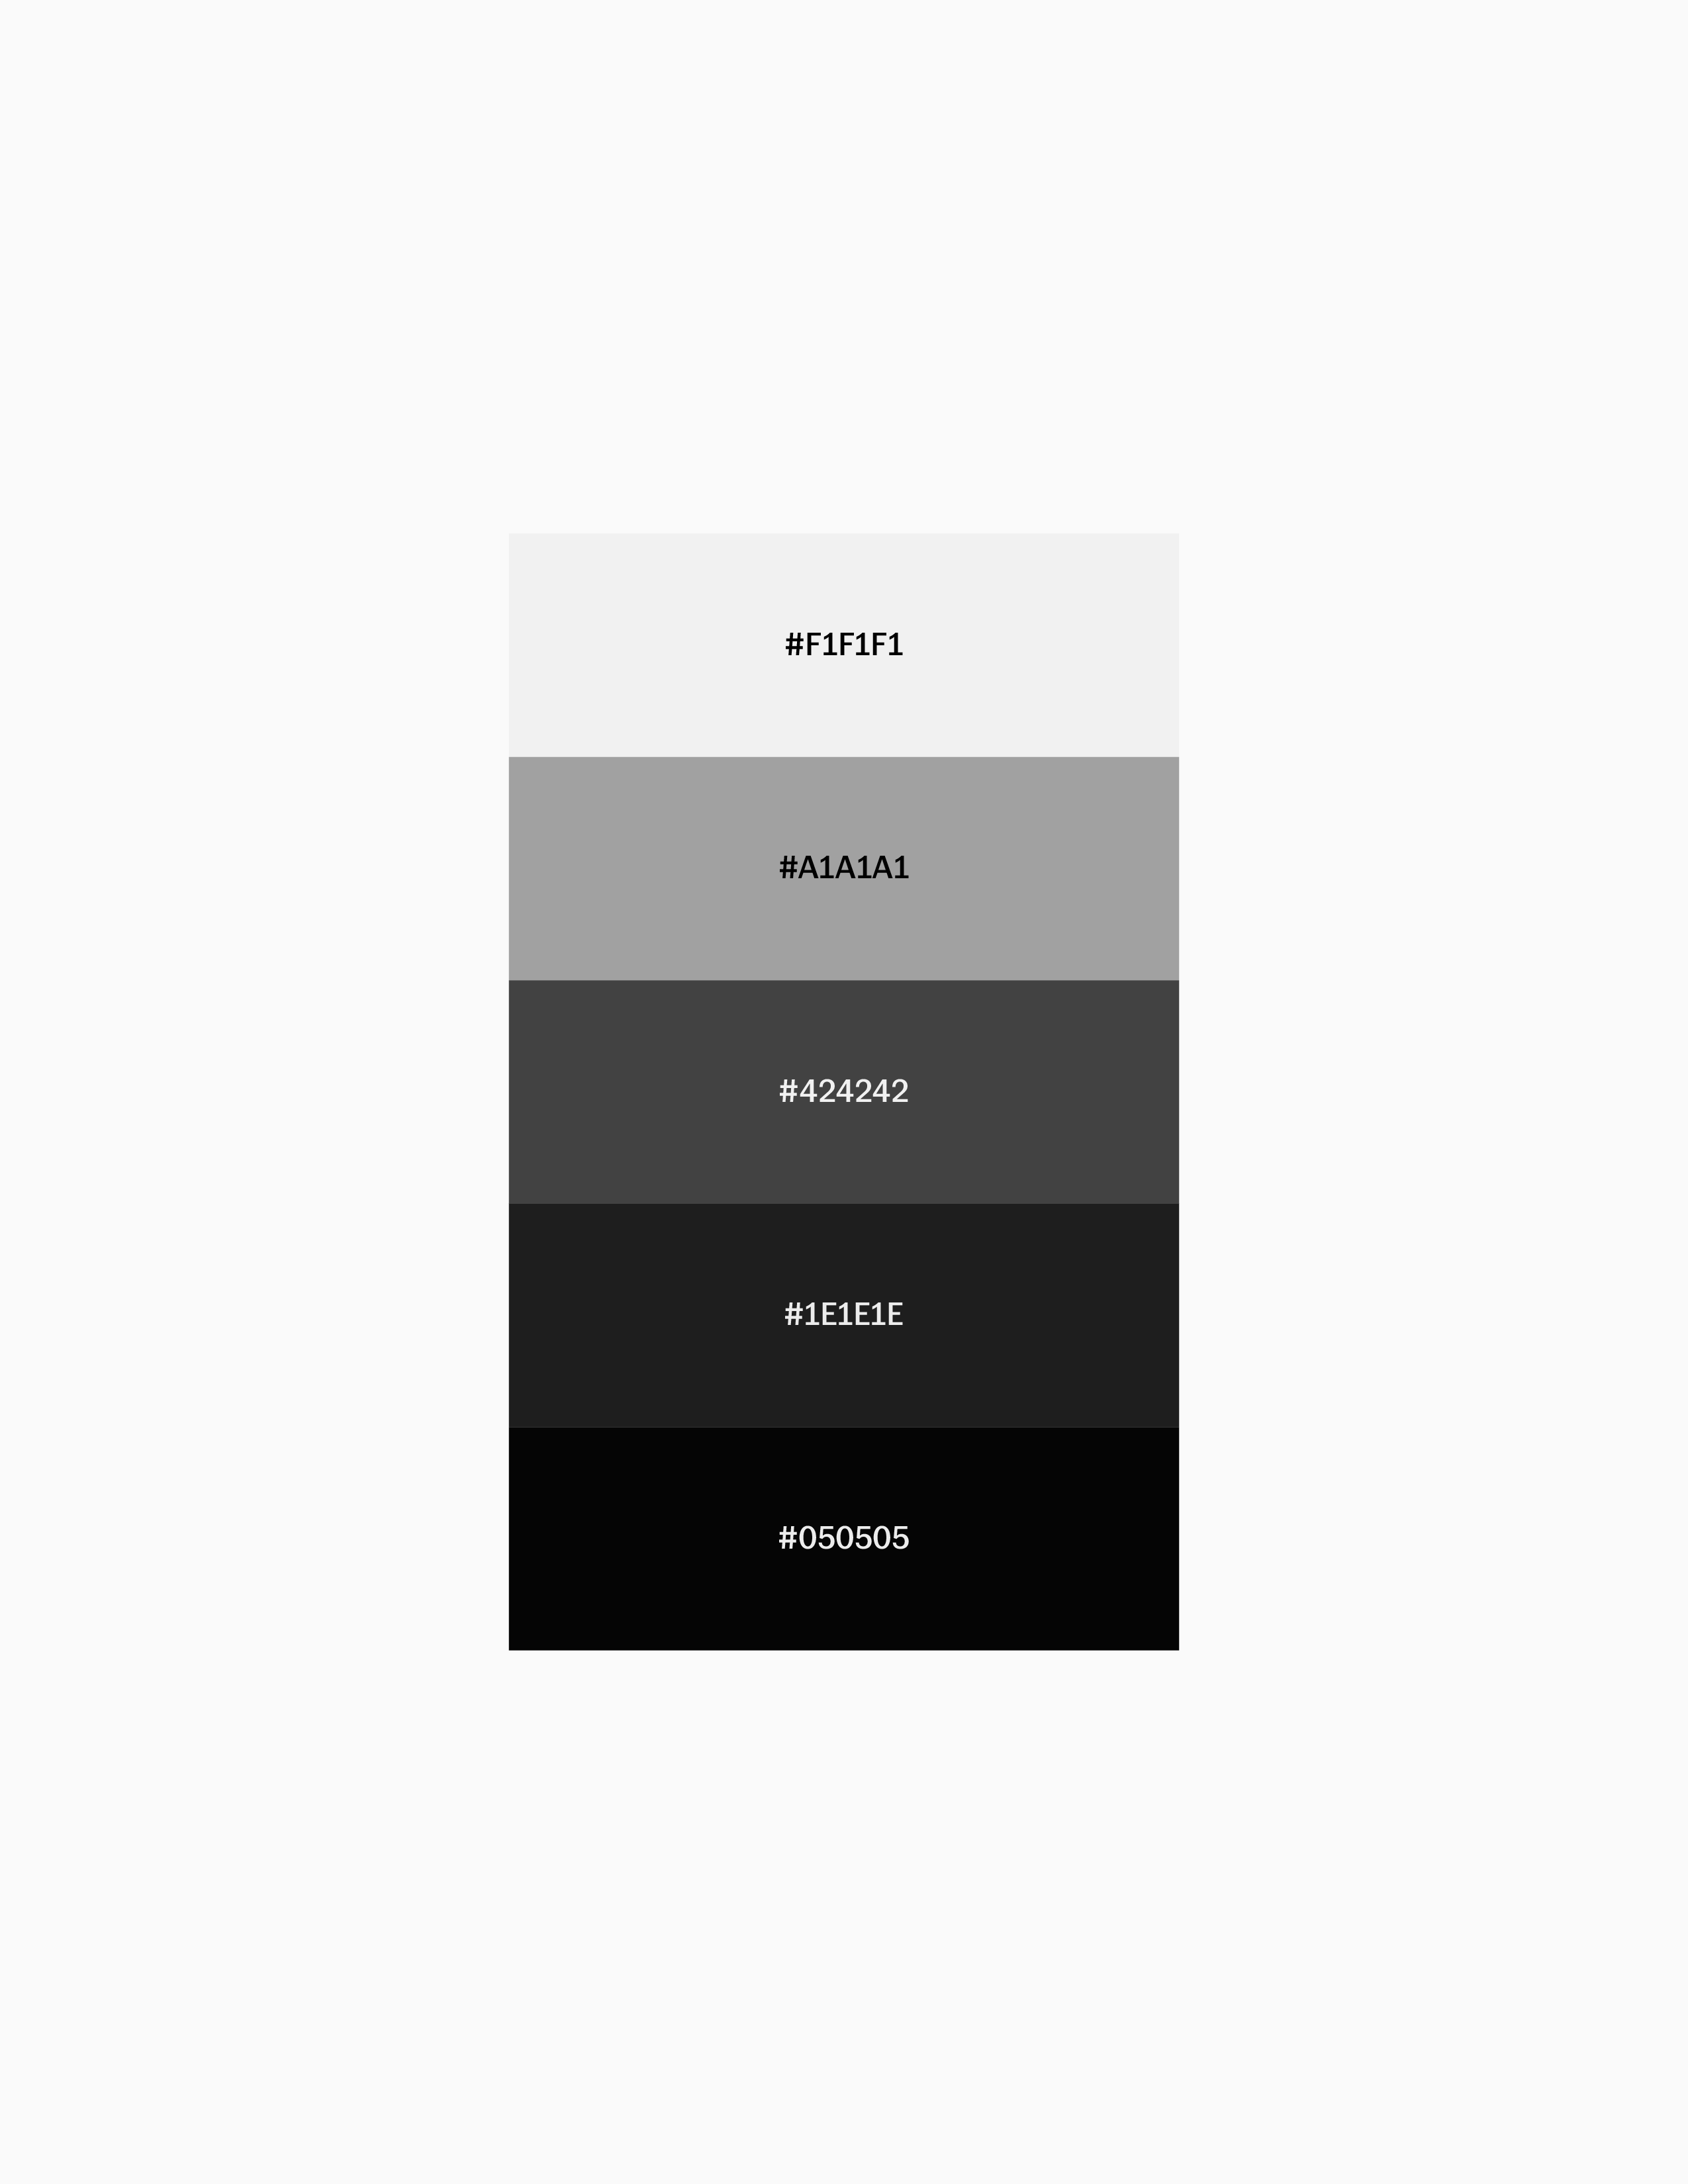
Color Palette
The extended palette provides options for differentiation and contrast in design elements. It includes charcoal tones and text-color pairings to enhance visual clarity and impact.

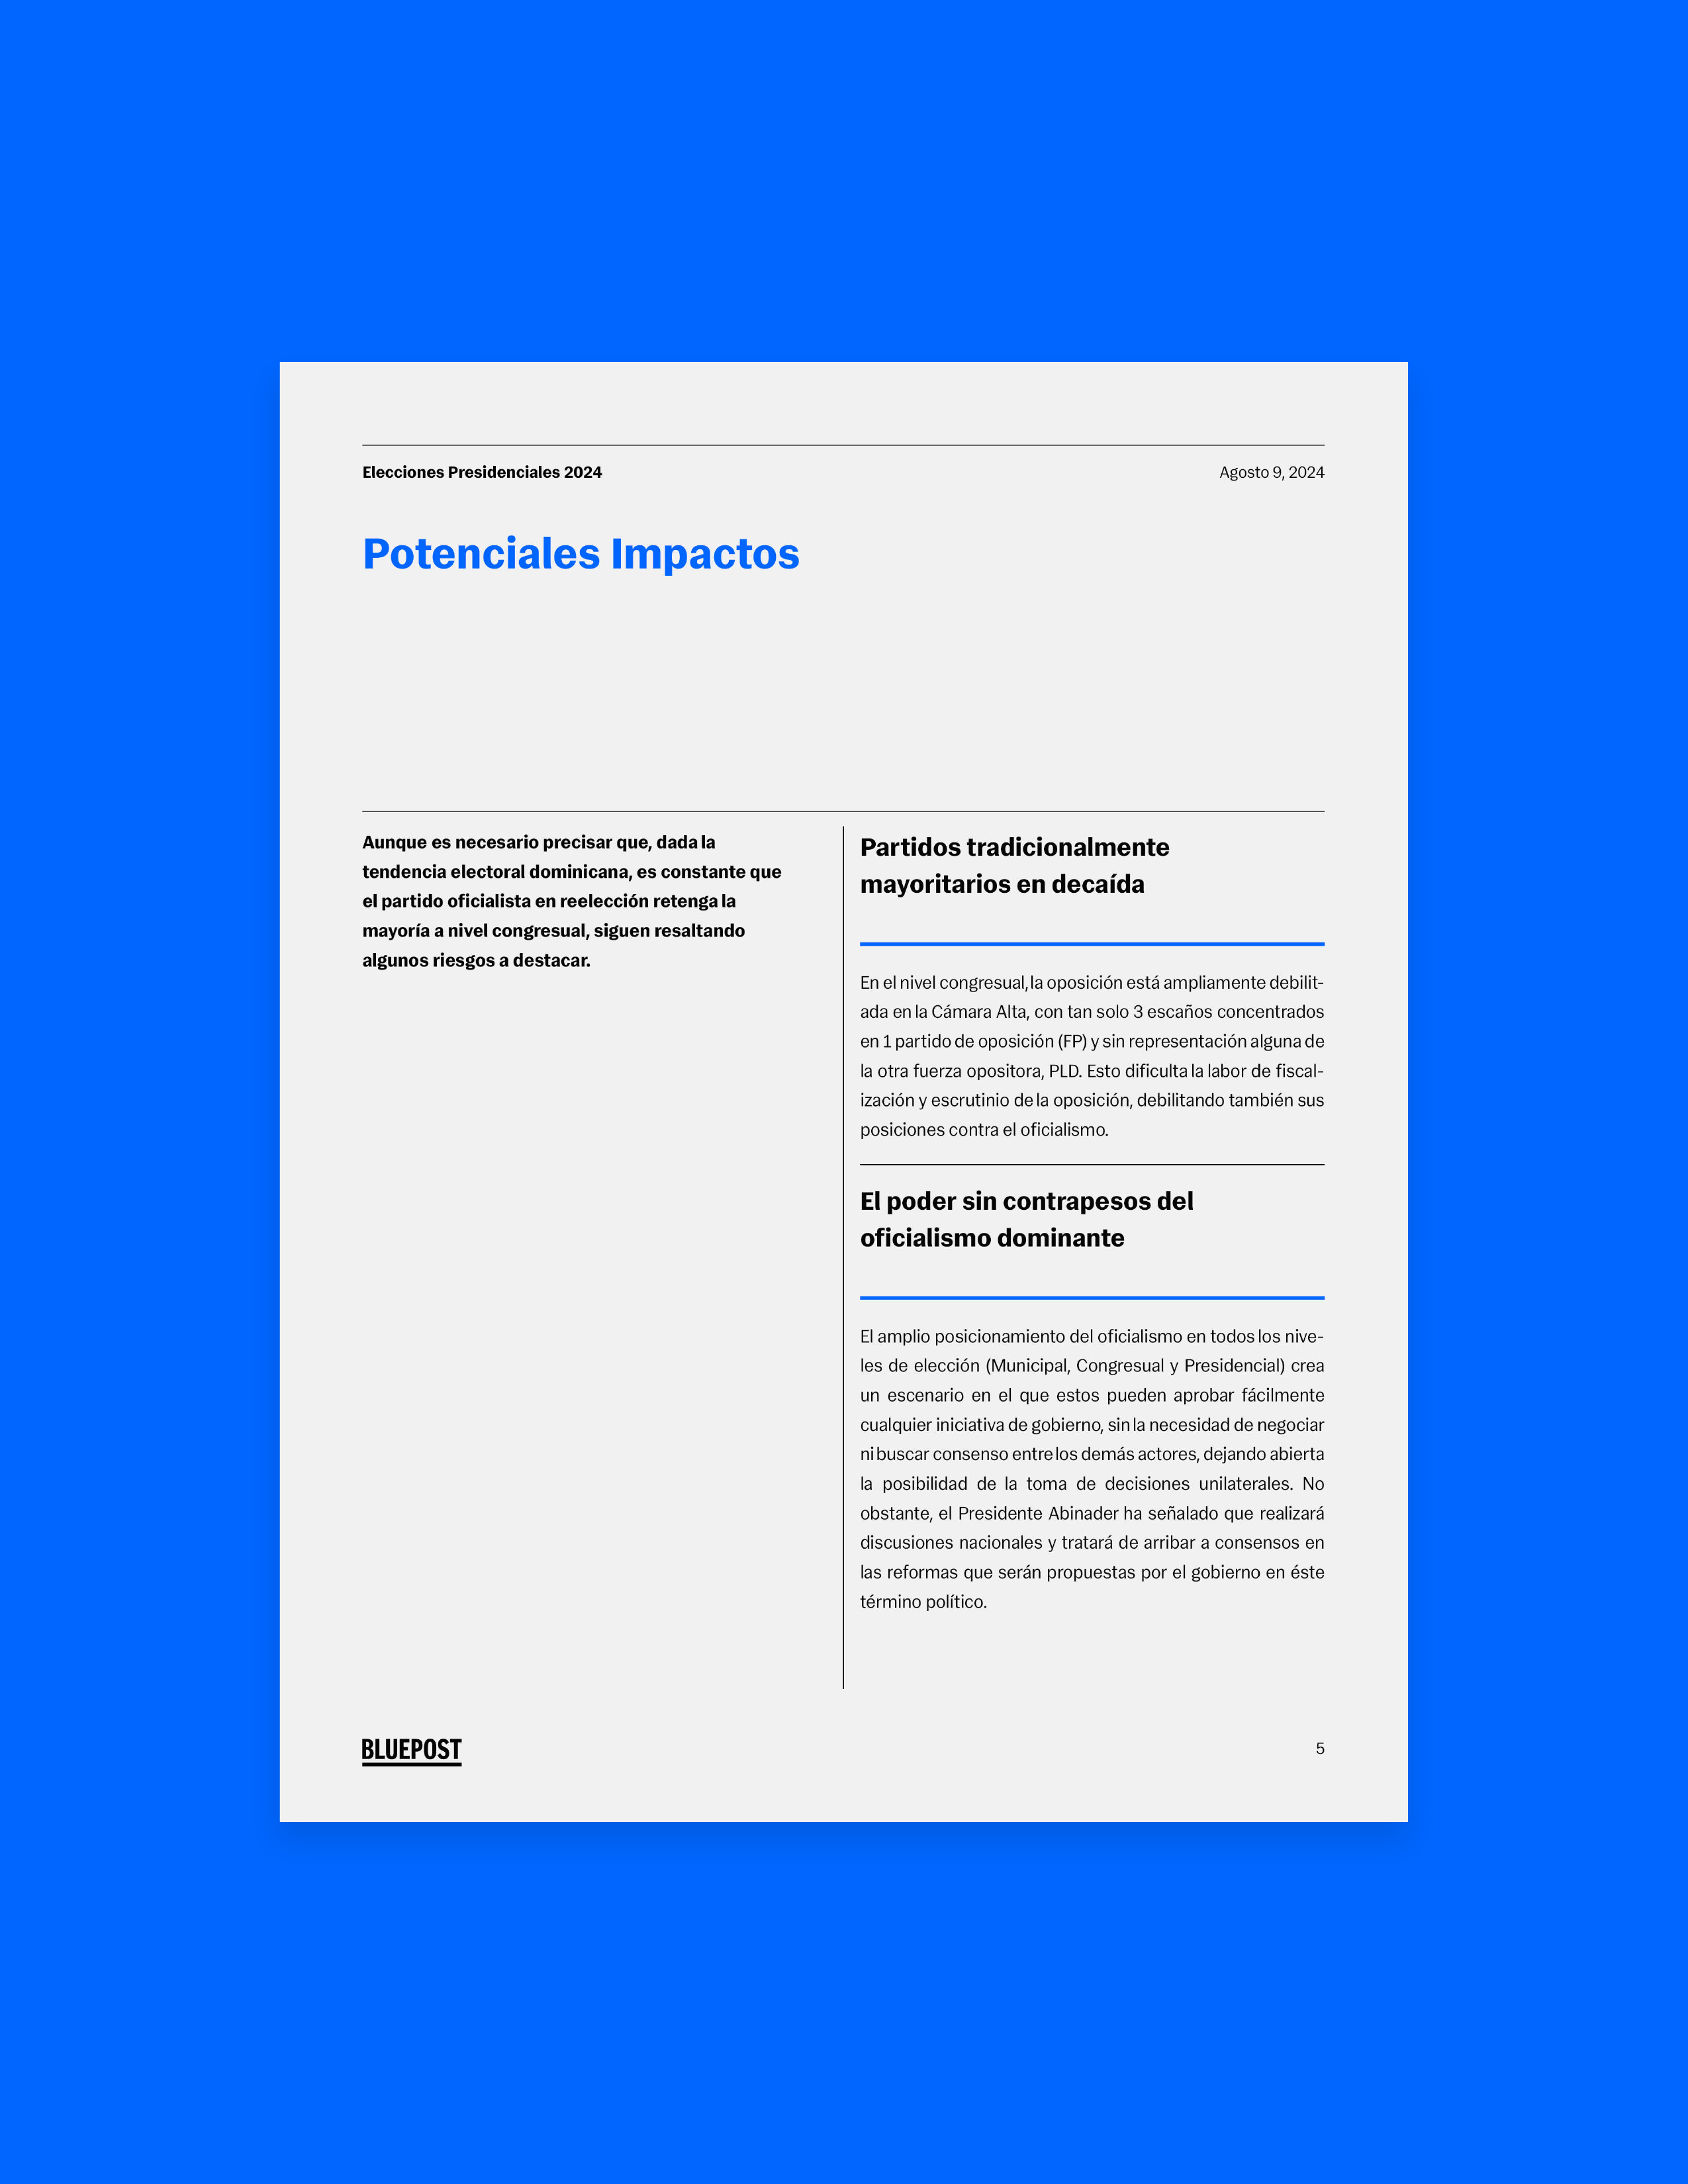
Publications
Blue Post’s primary publication formats include newsletters tailored to different needs: a long format for ‘newspaper-like’ features, a short format for single articles, and an email-based newsletter for marketing.

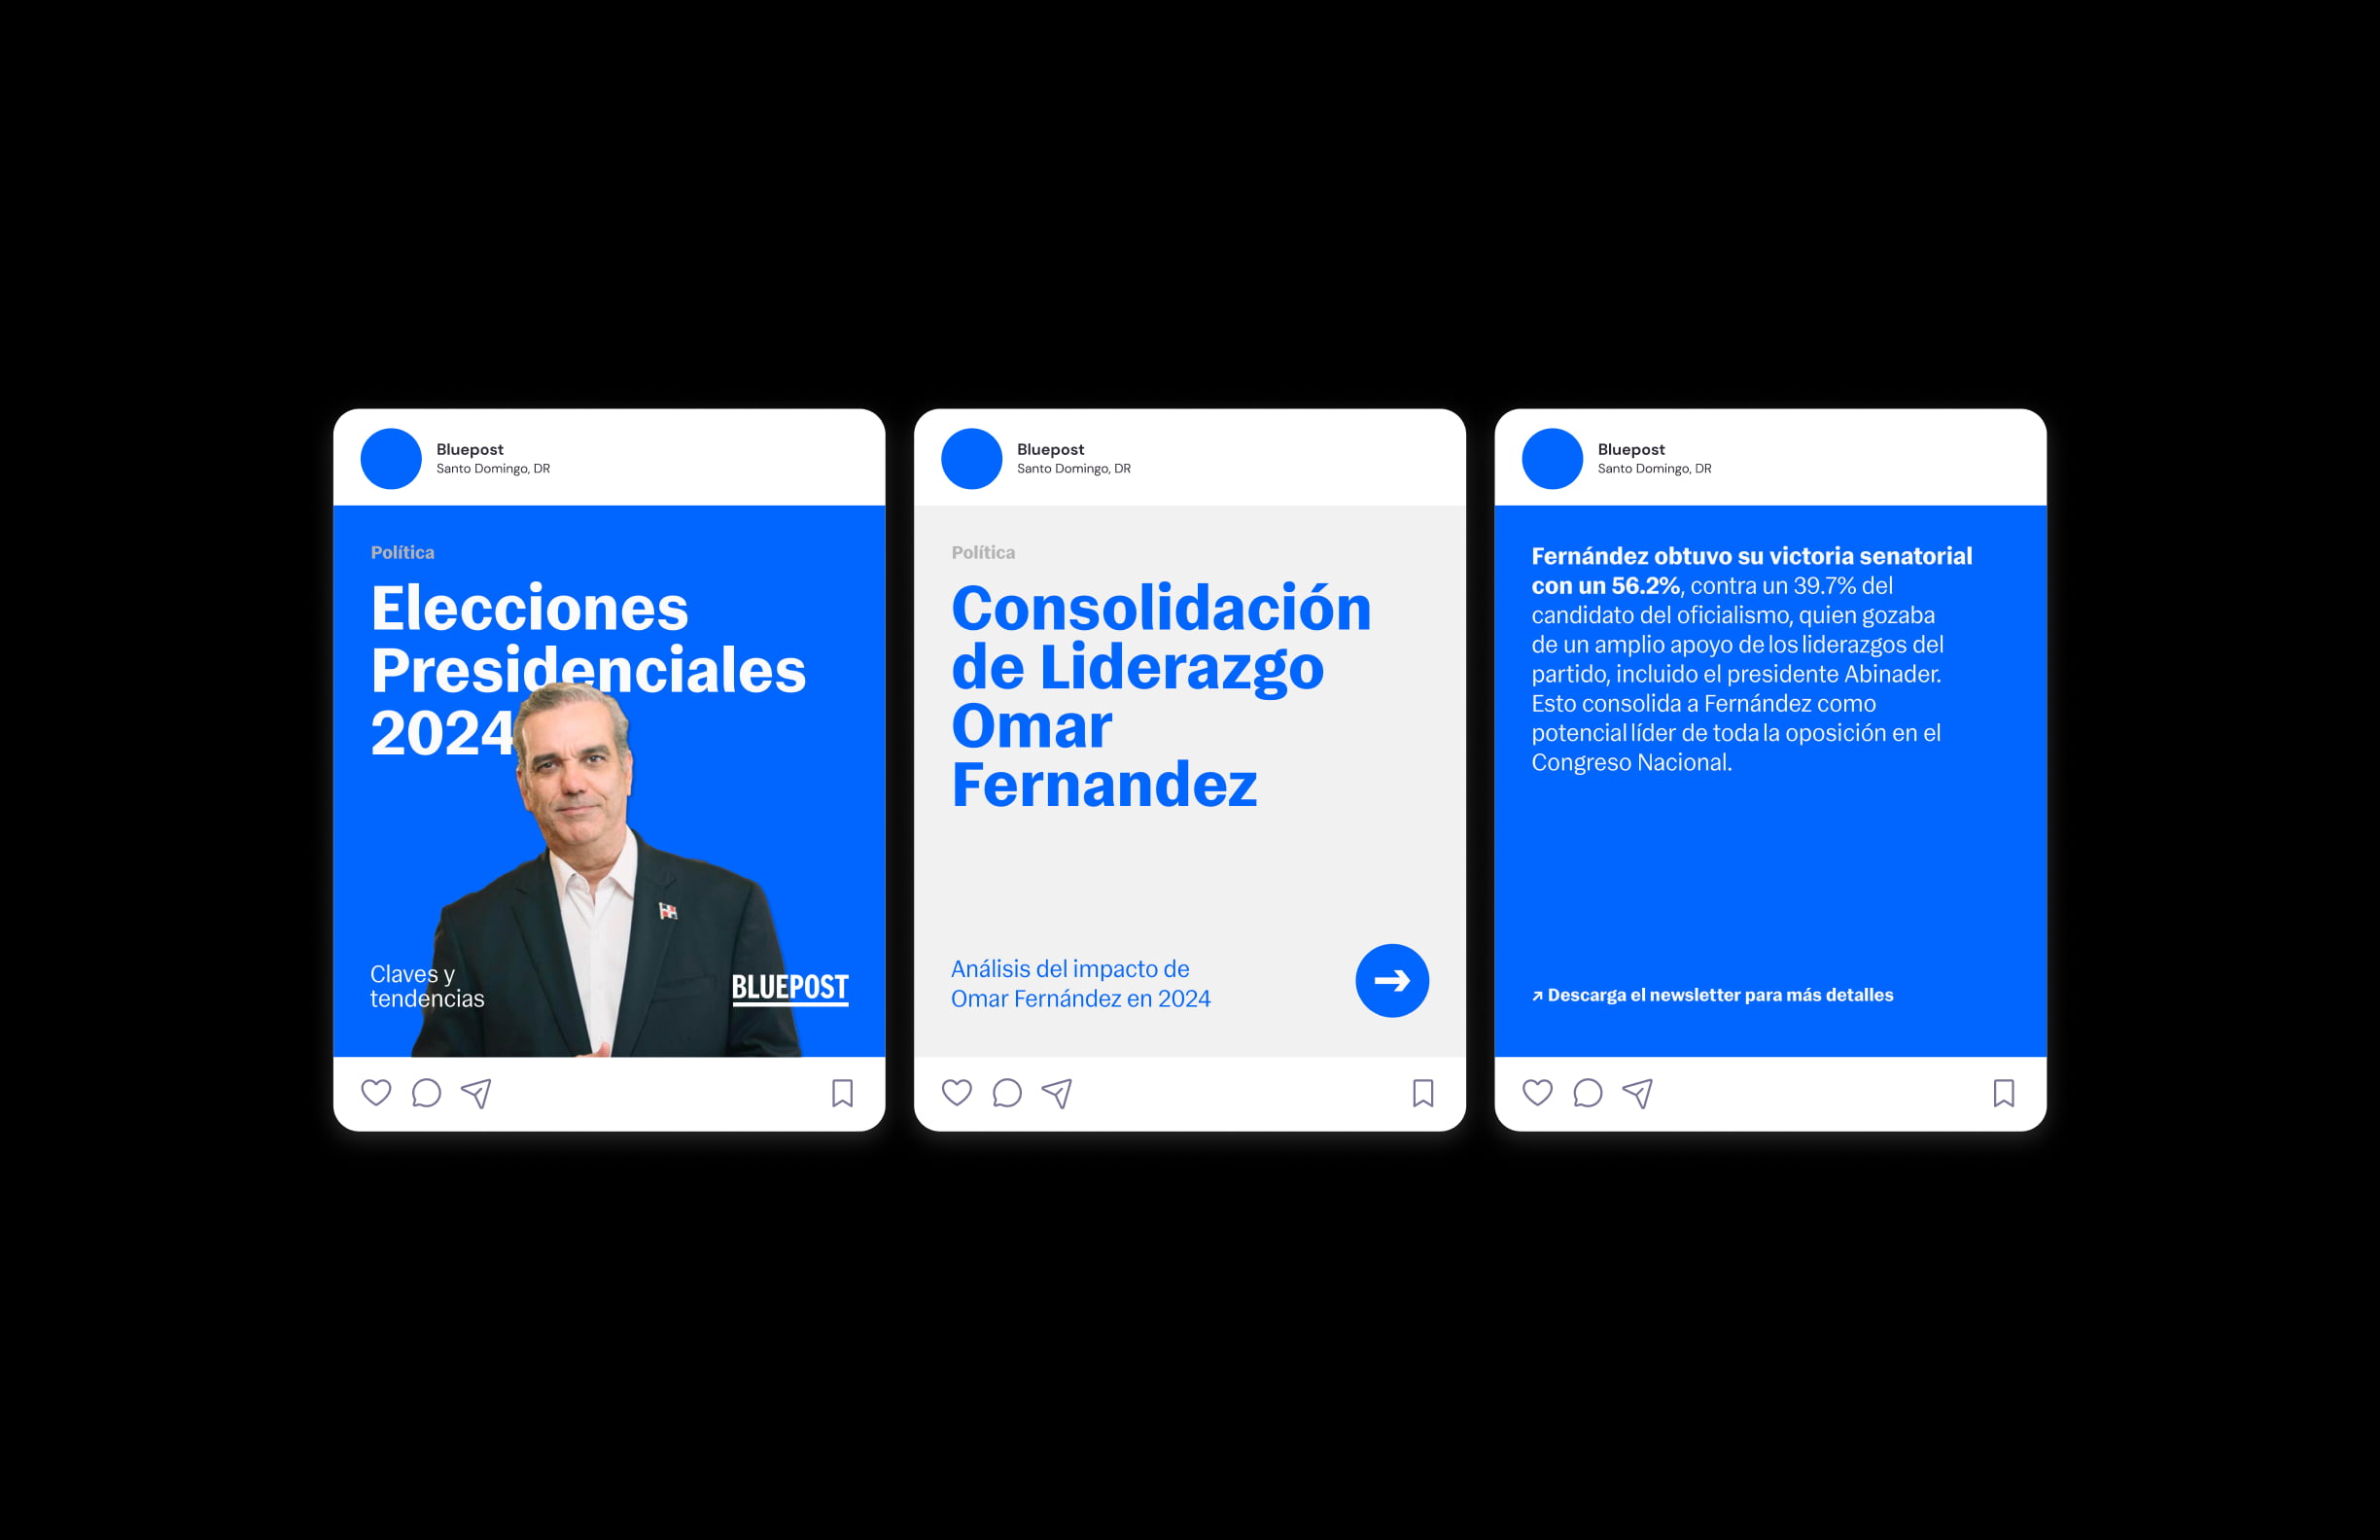
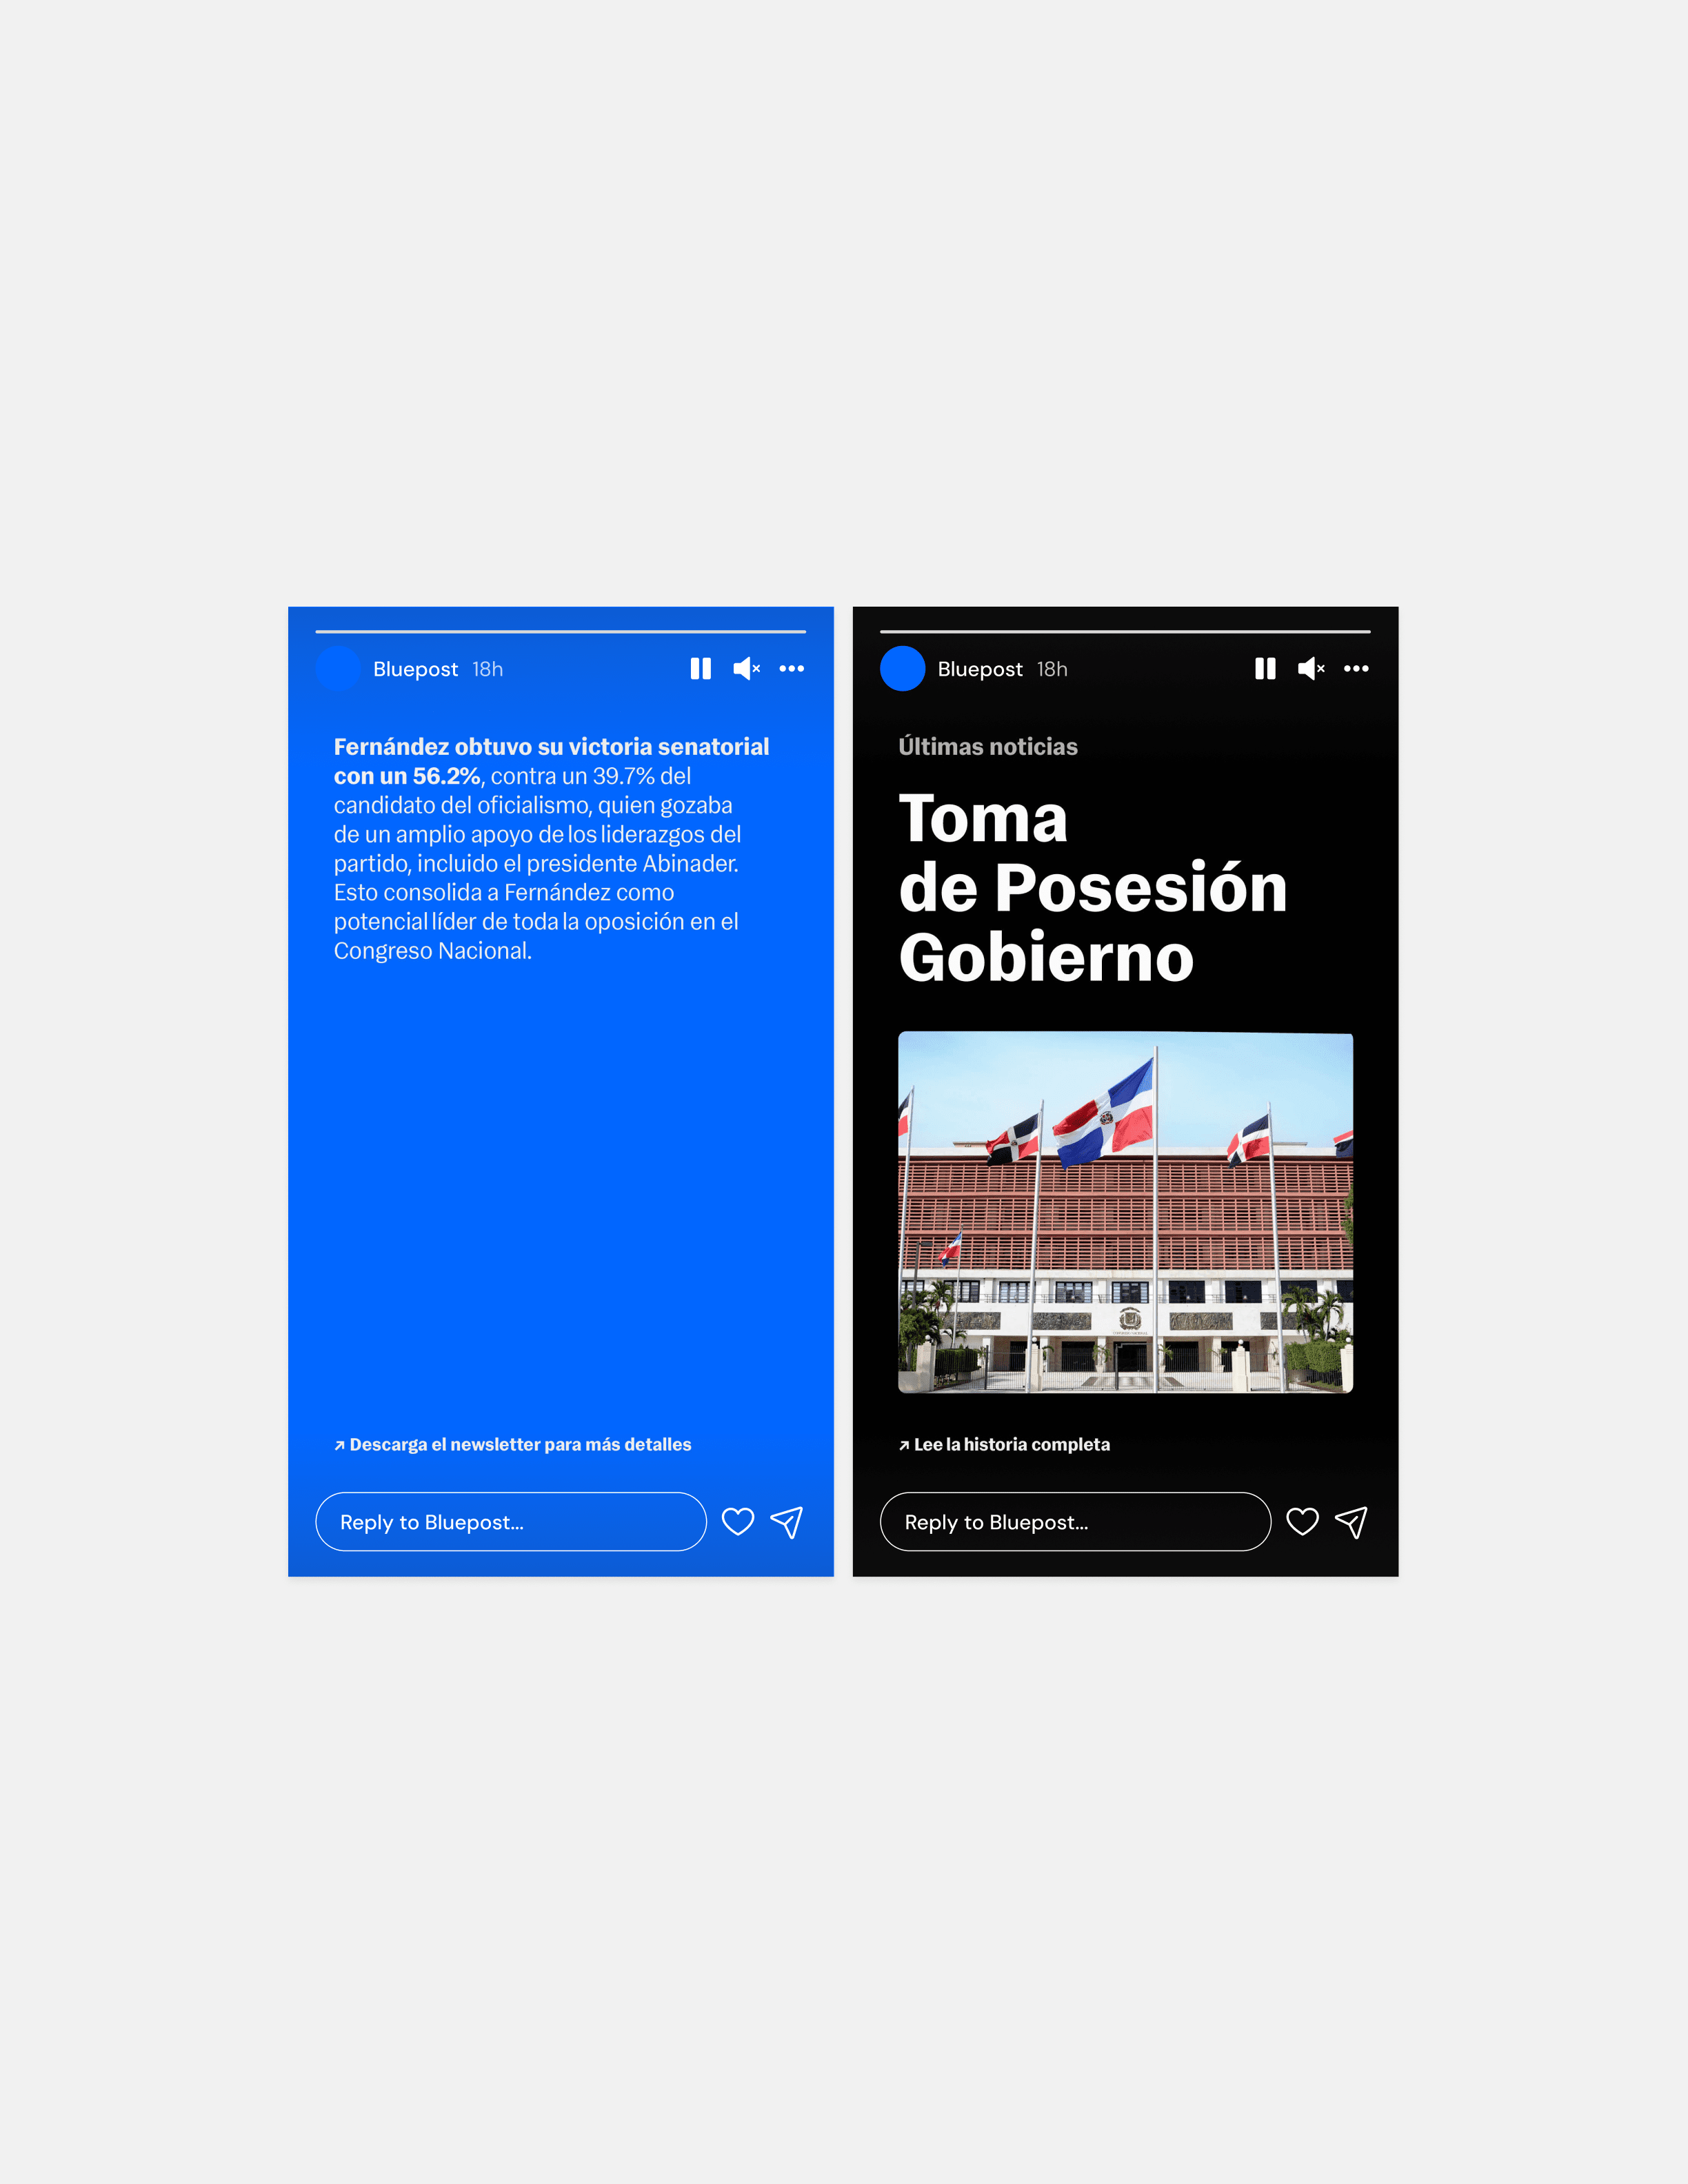
Social Media
Social media is a key part of Blue Post’s digital strategy. Like the publications, the approach is straightforward and informative, emphasizing clear communication of impartiality and honesty.

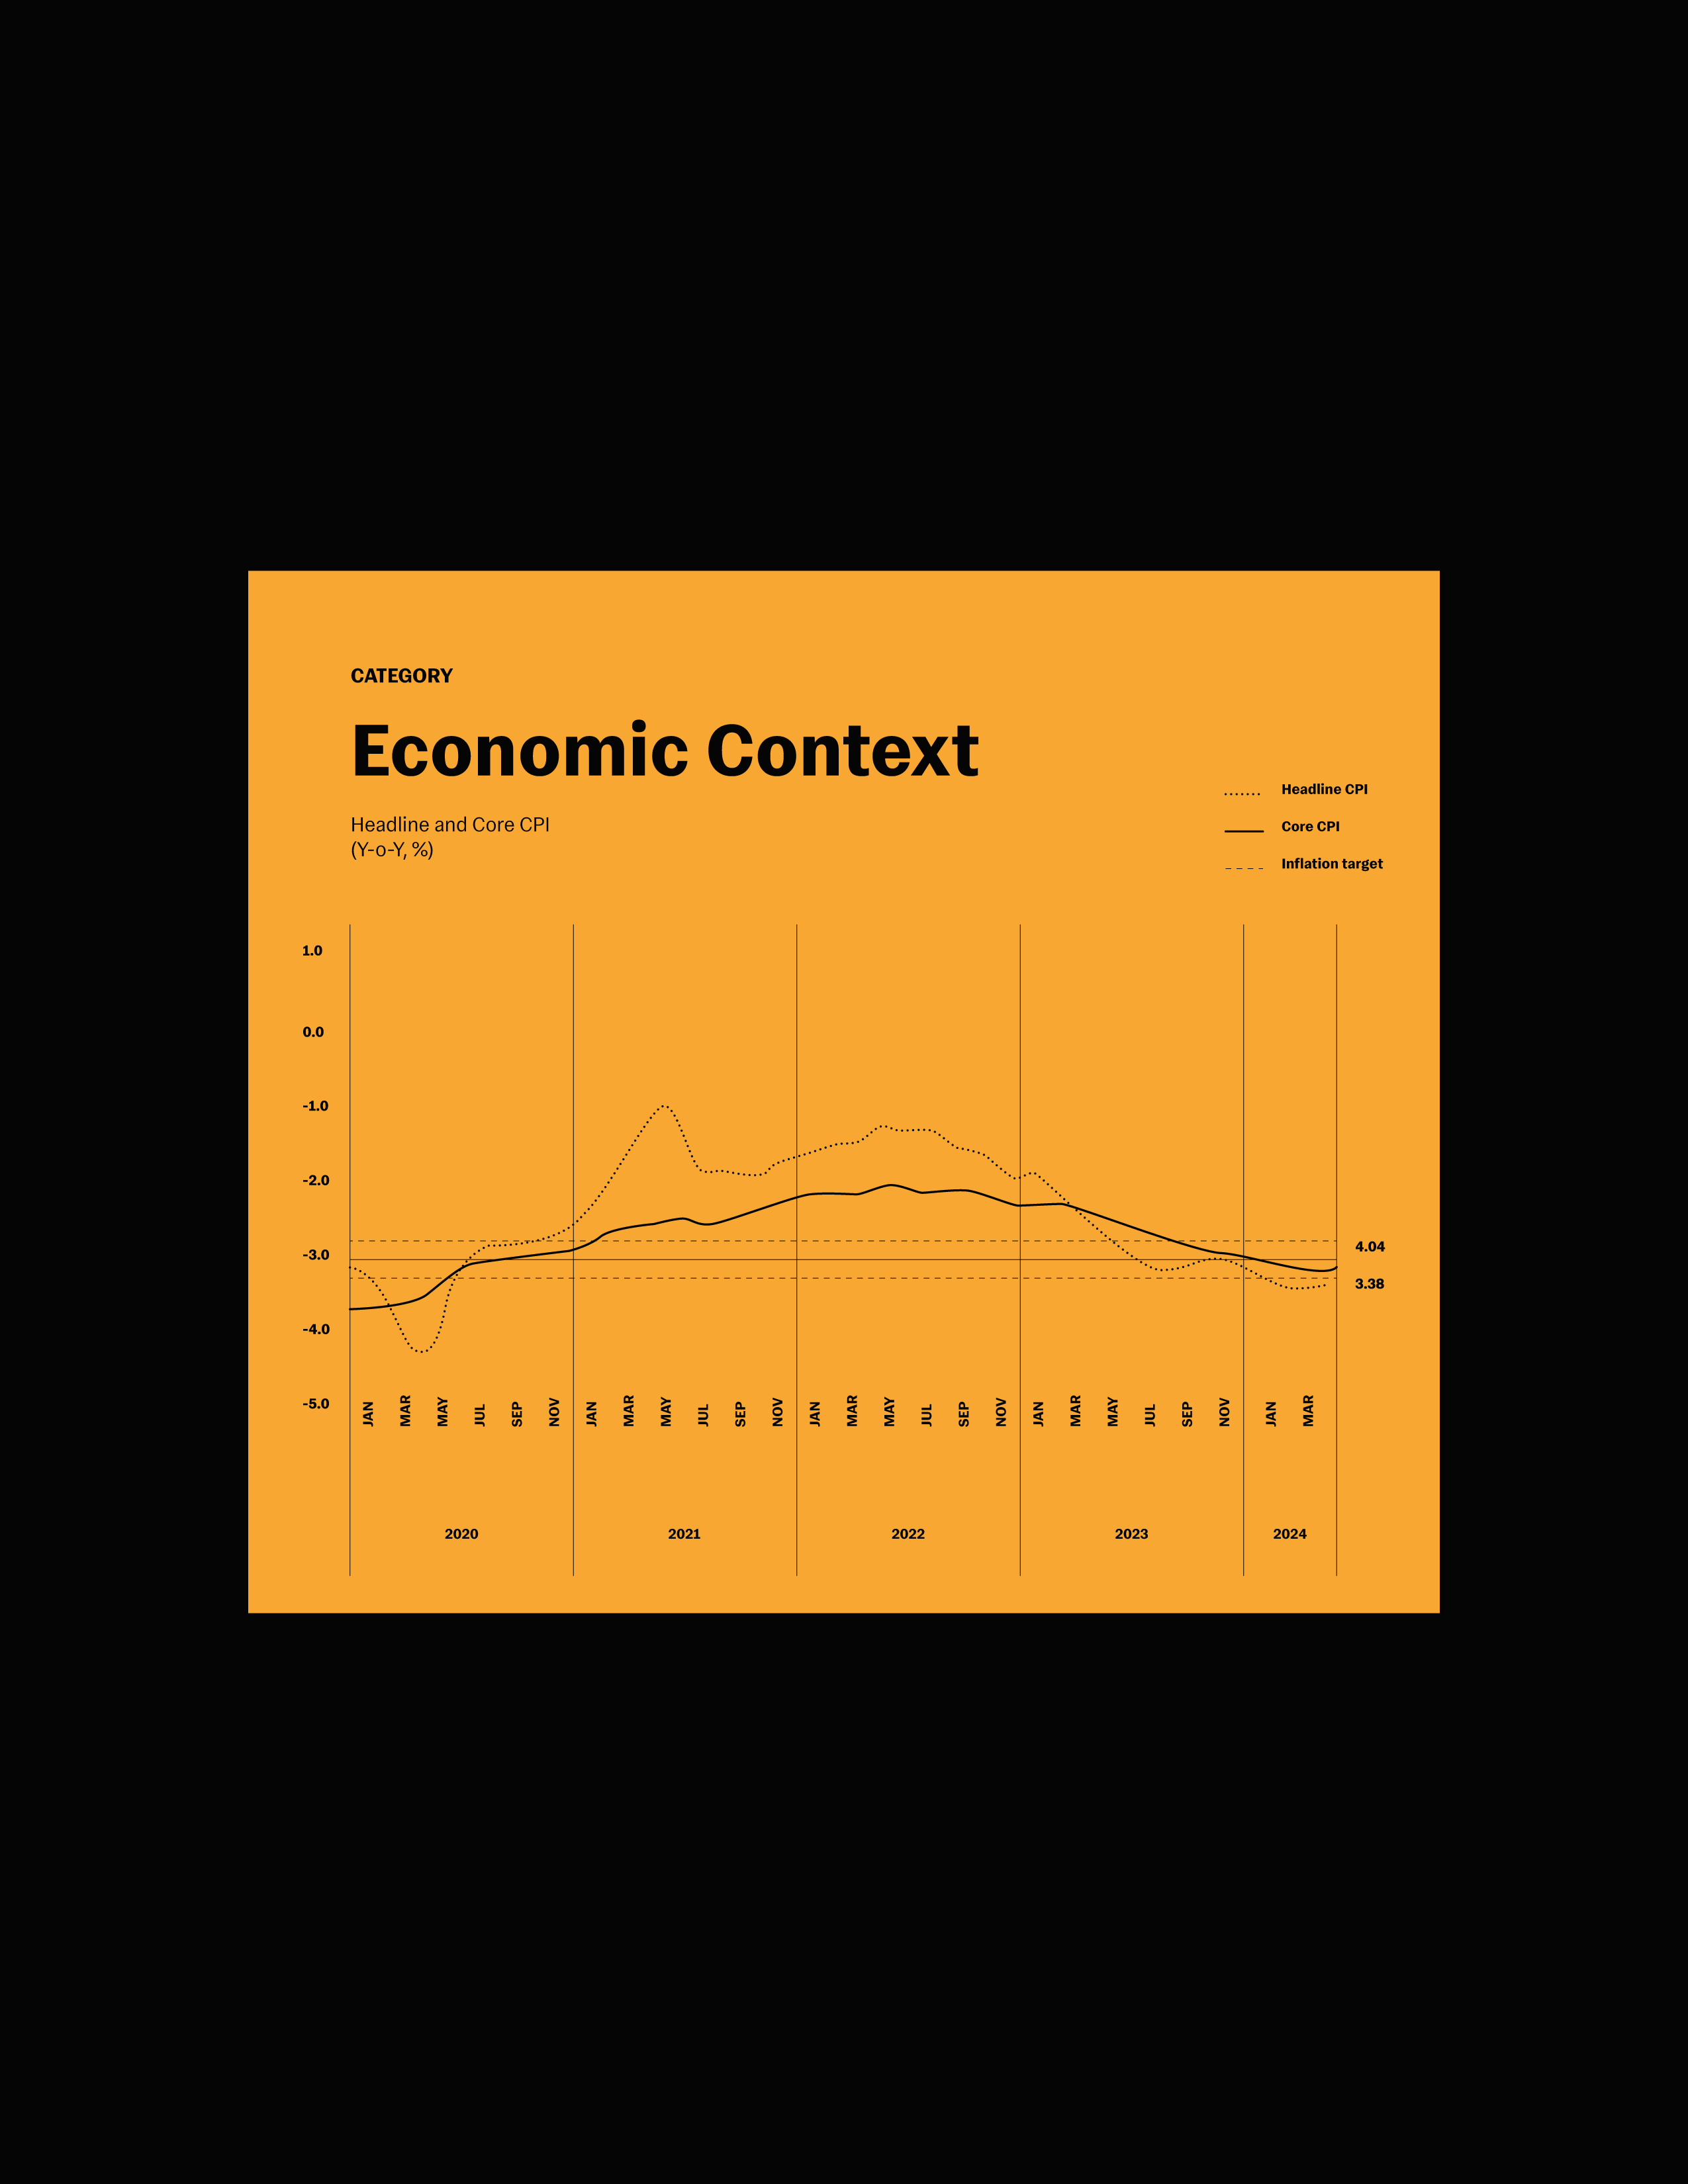
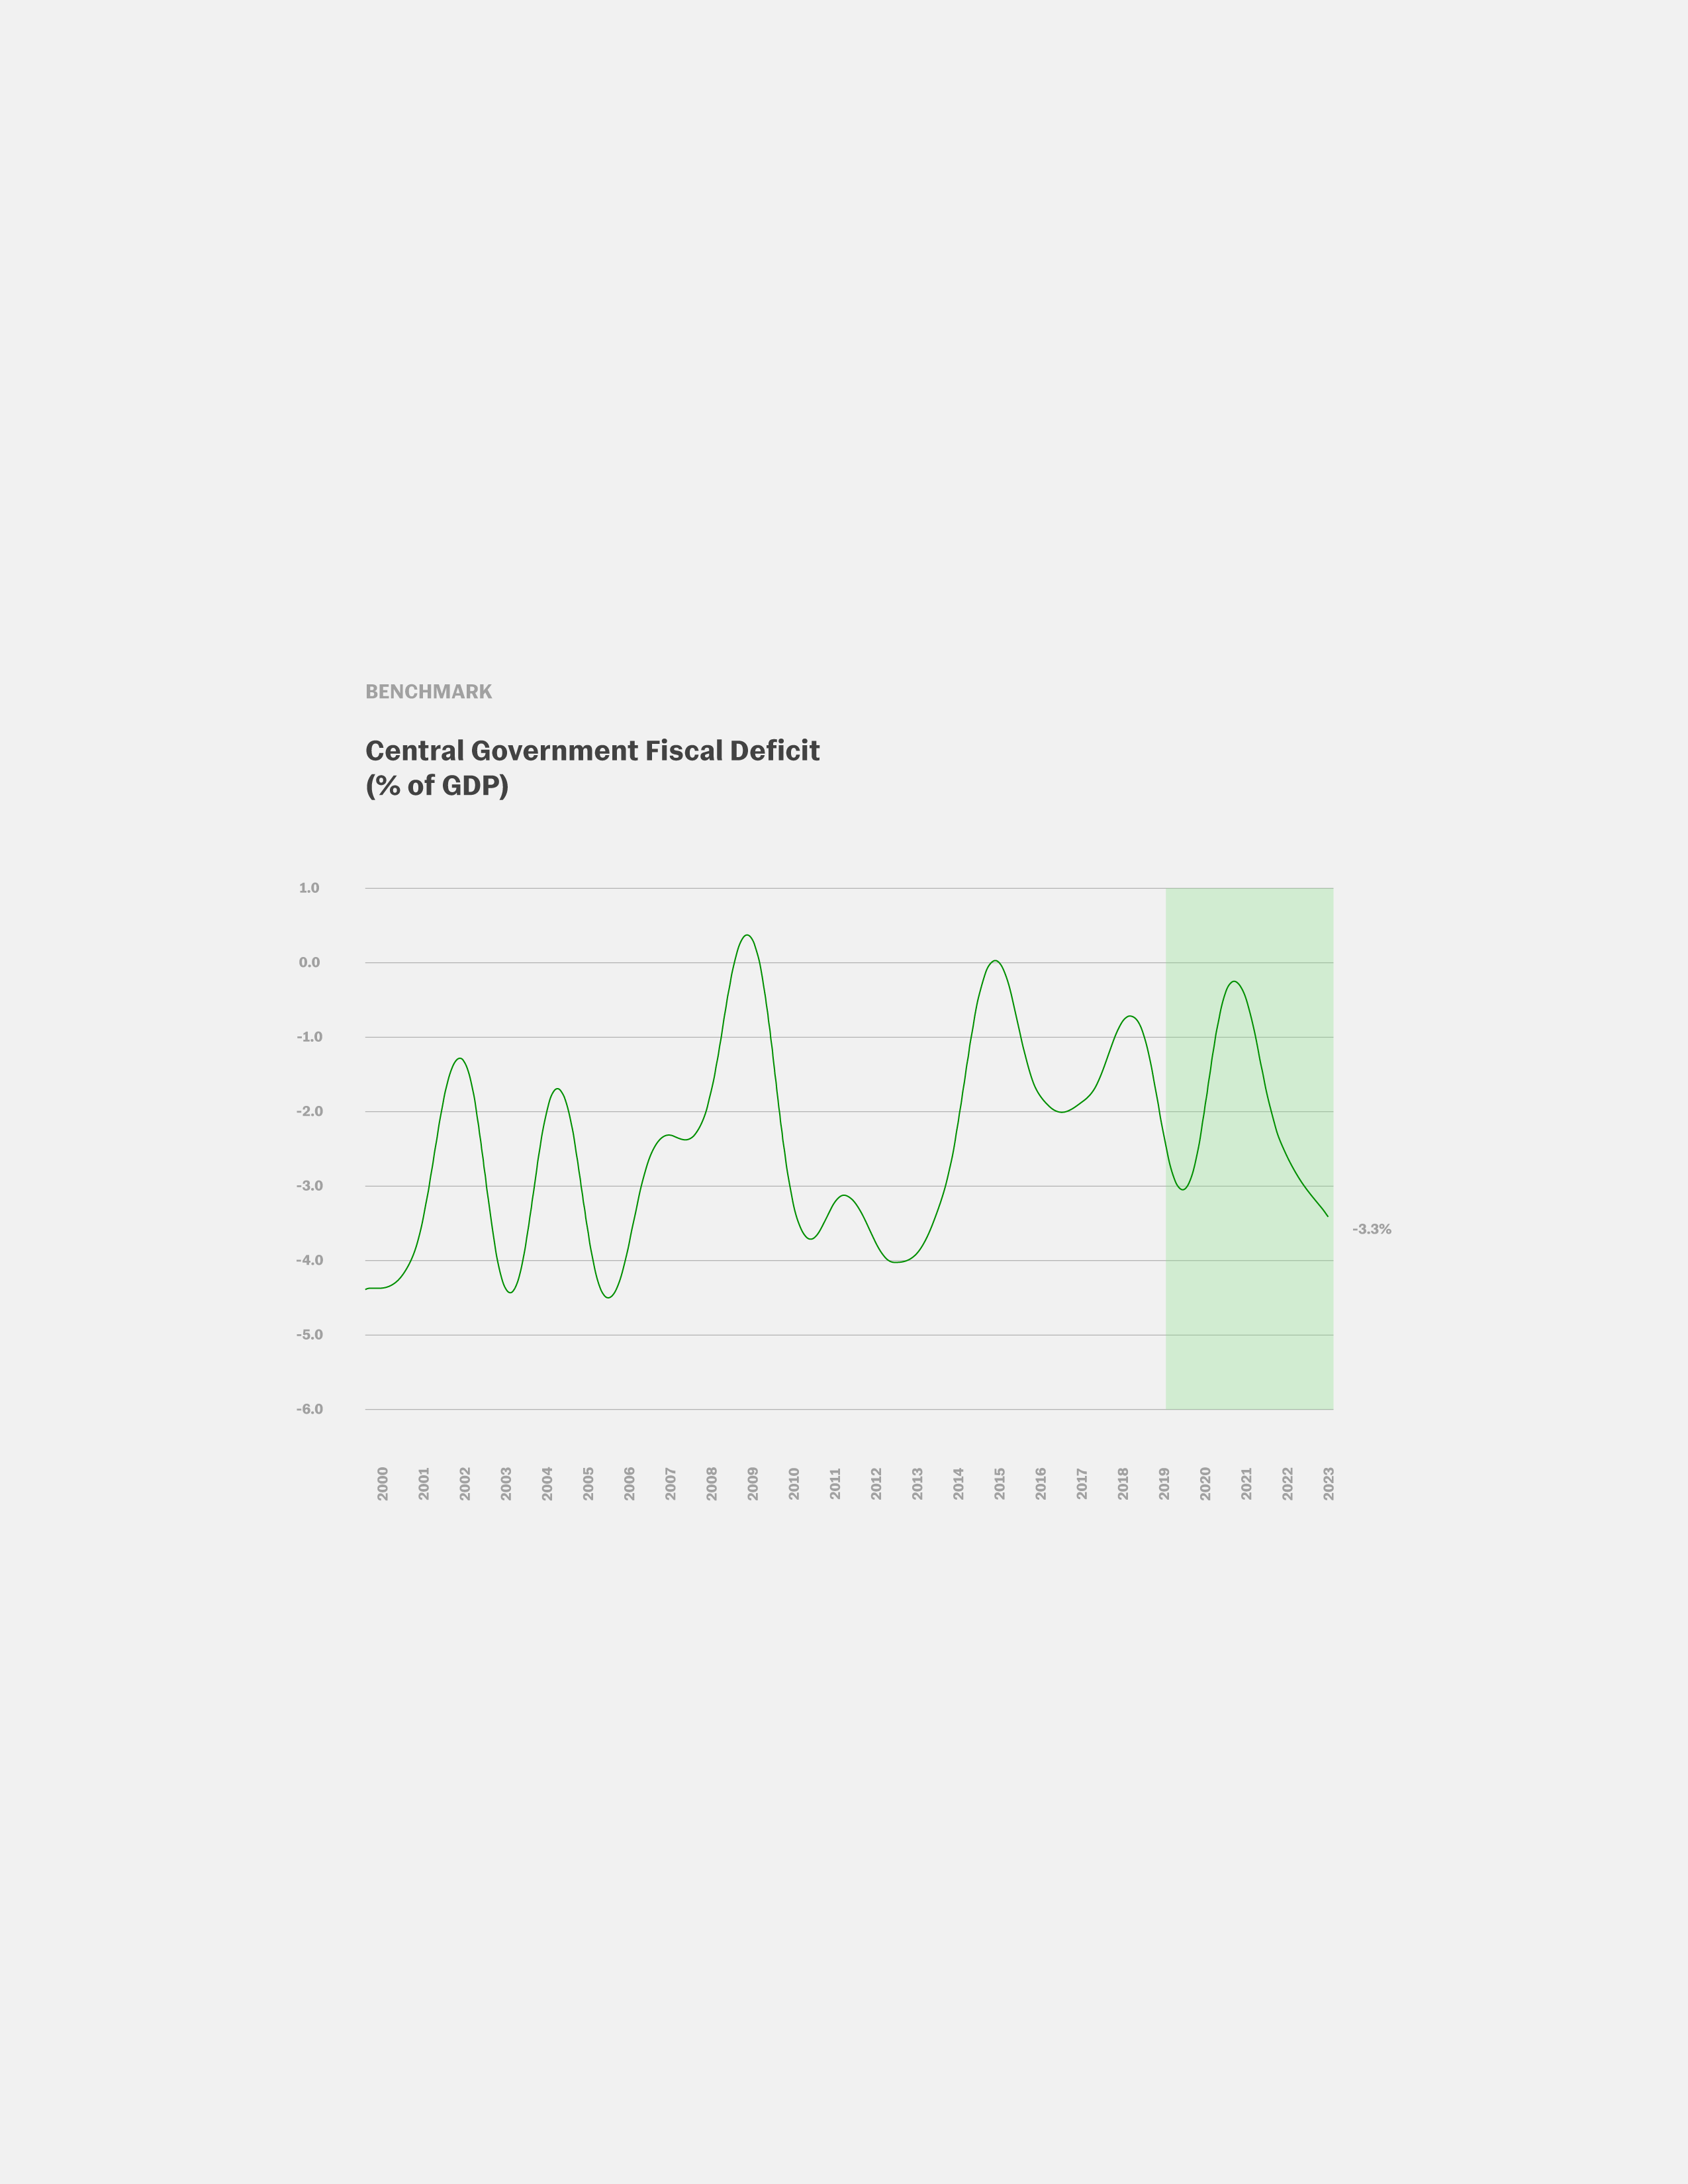
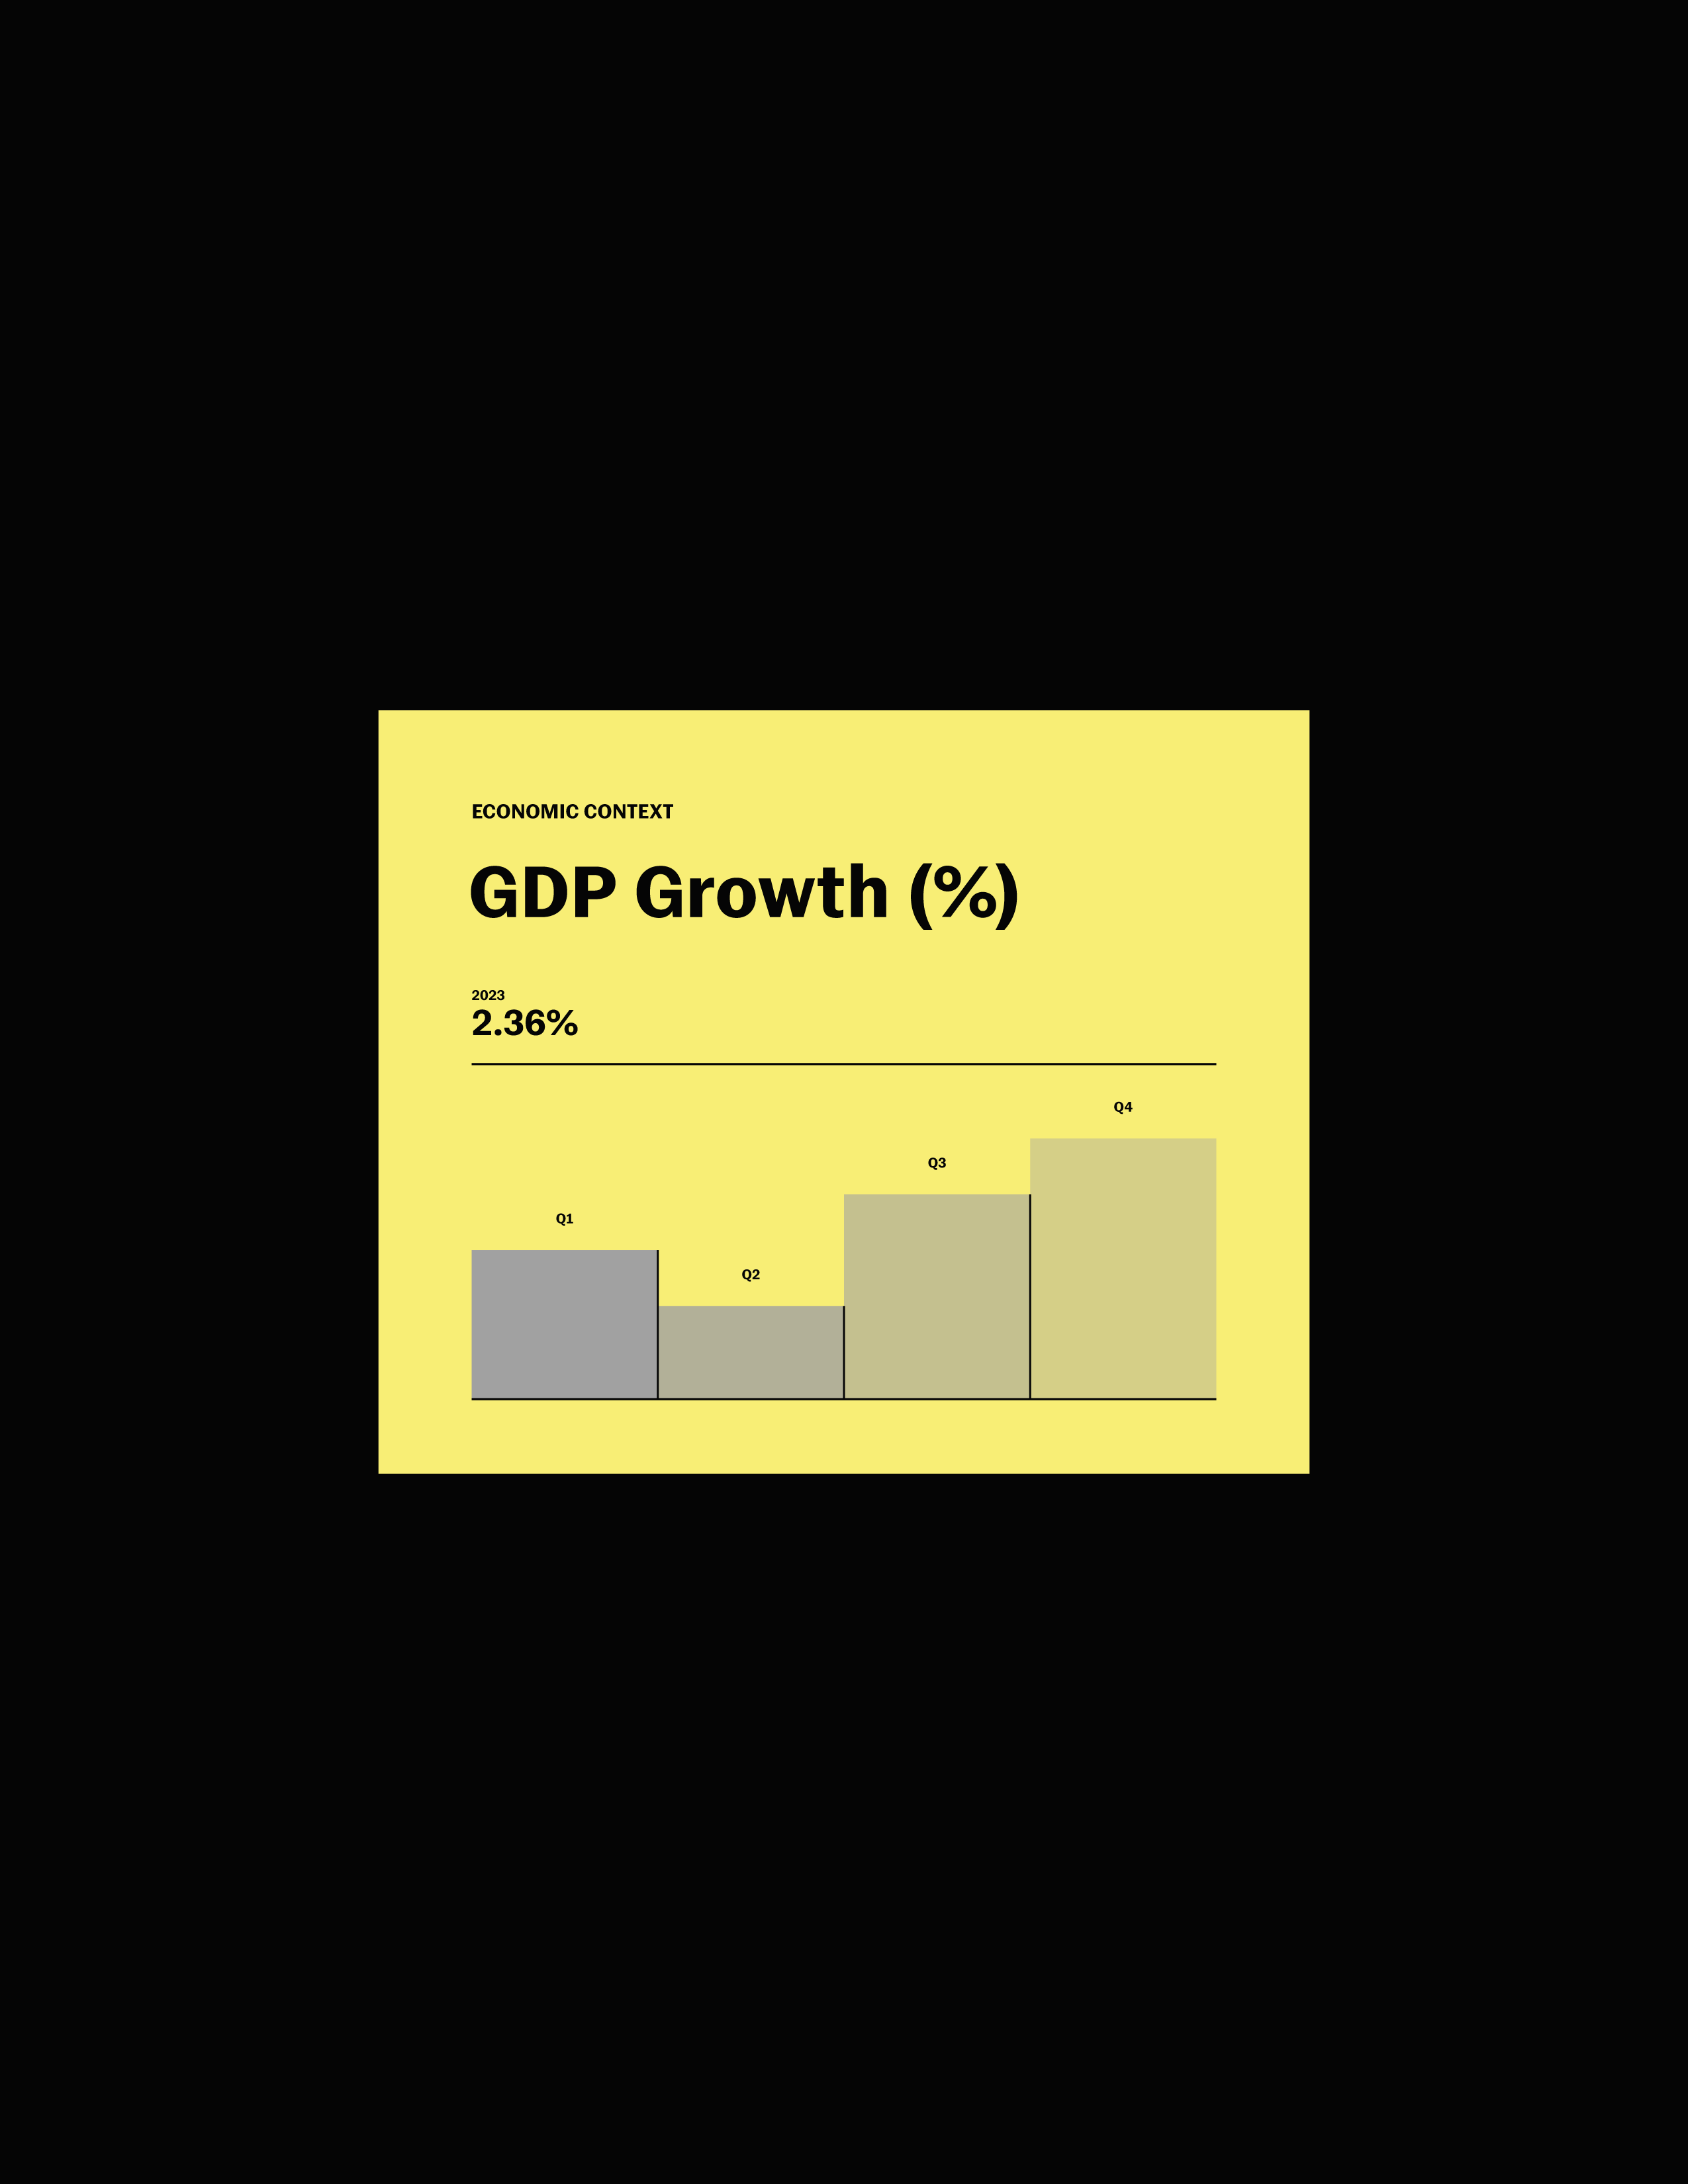
Tables & Layout
Graphs and tables are key to clear data presentation. They simplify complex information, while the color system maintains consistency and highlights categories.